Fairfax County Market Update November-


The Fairfax County housing data for Nov 30–Dec 6 confirms a market that remains competitive, with limited inventory and buyers still actively writing offers. For sellers, that environment generally supports realistic pricing and solid contract terms. For buyers, it means you need to be prepared, pre-approved, and decisive when the right home appears. In short, the numbers in this weekly report point to a market that still rewards good preparation on both sides.
What can buyers and sellers learn from the Fairfax County housing data for Nov 30–Dec 6?
- The weekly data confirms that homes are still selling, not sitting, when they are priced and presented correctly.
- Inventory remains limited compared to the number of buyers in the market, which keeps well-positioned listings in demand.
- Average days on market and sale-to-list patterns show that serious buyers are acting quickly once they find the right property.
- The price levels in the report reflect a market where condition, location, and pricing strategy all matter more than ever.
- Both buyers and sellers need a clear strategy before they act, not after they are already under contract.
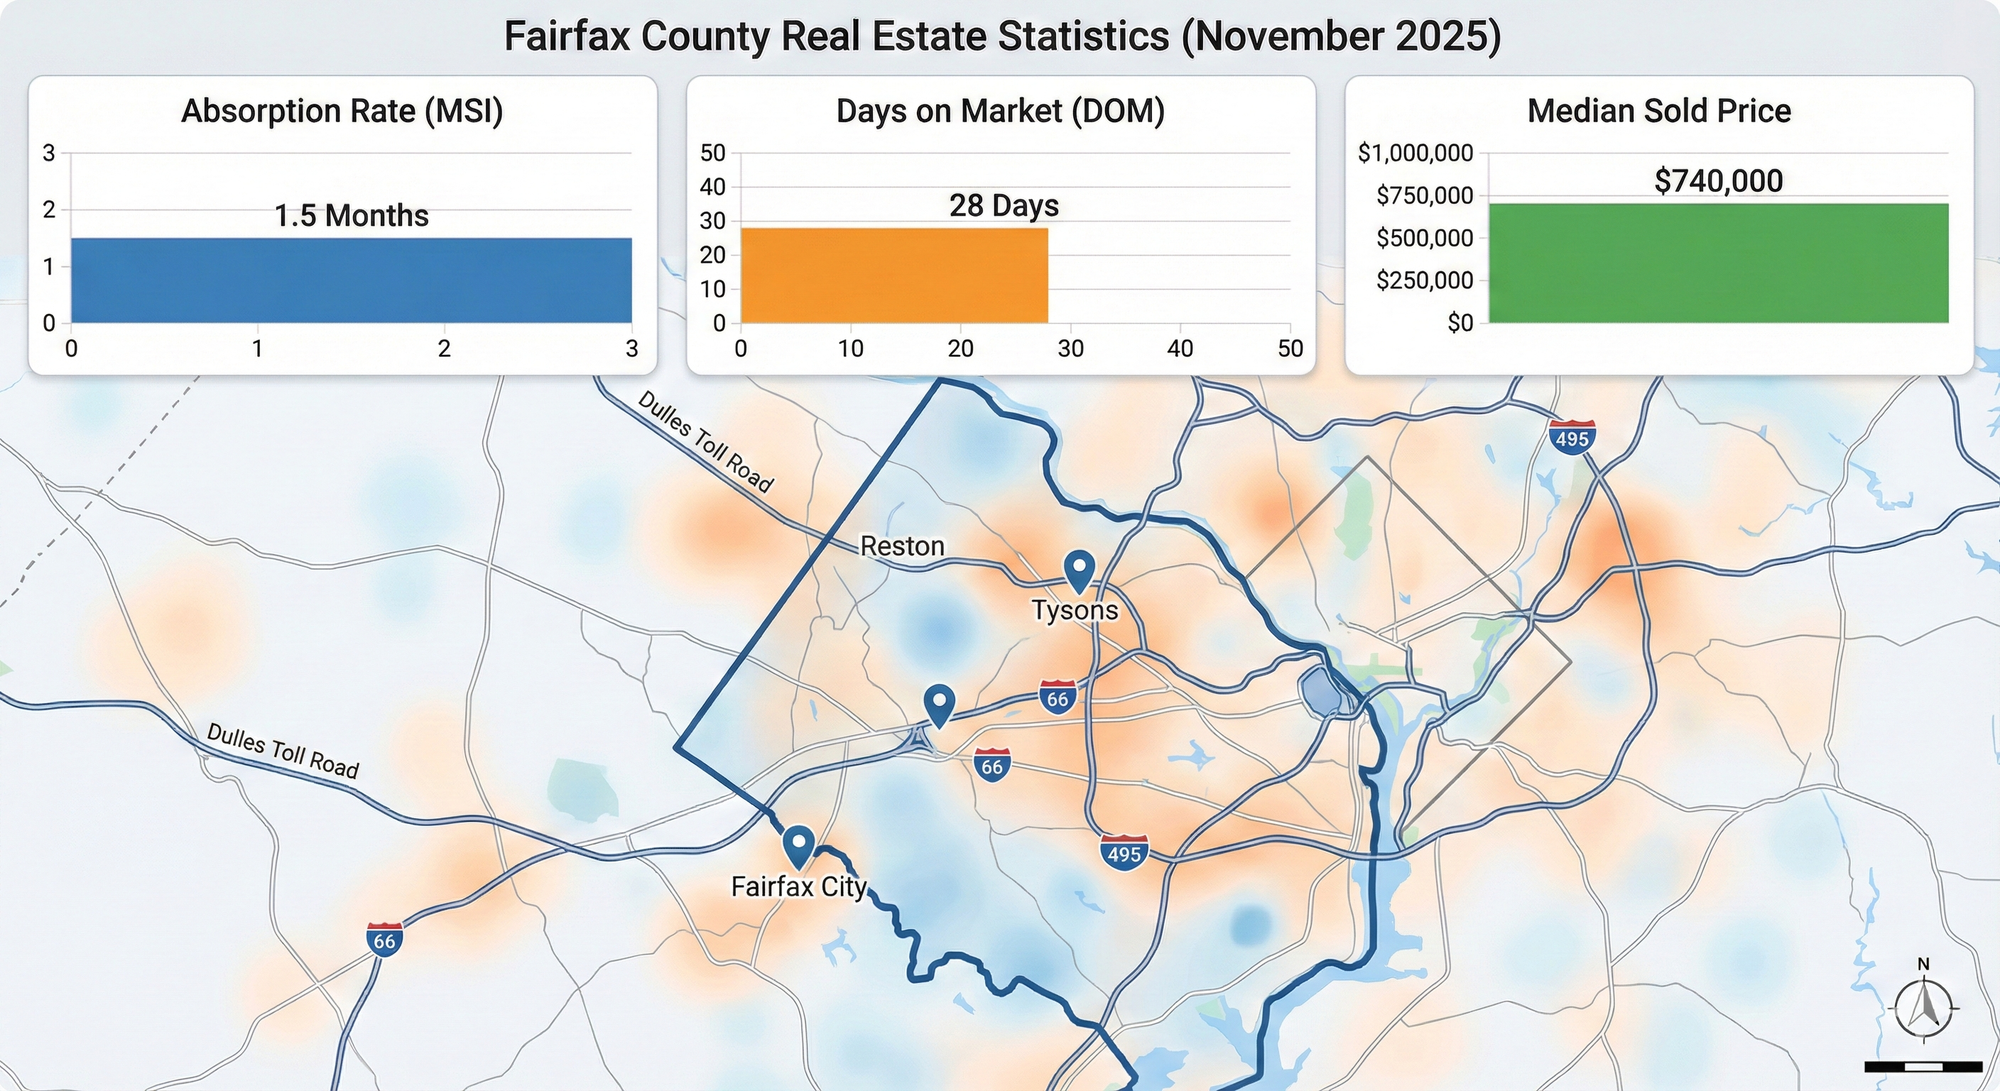
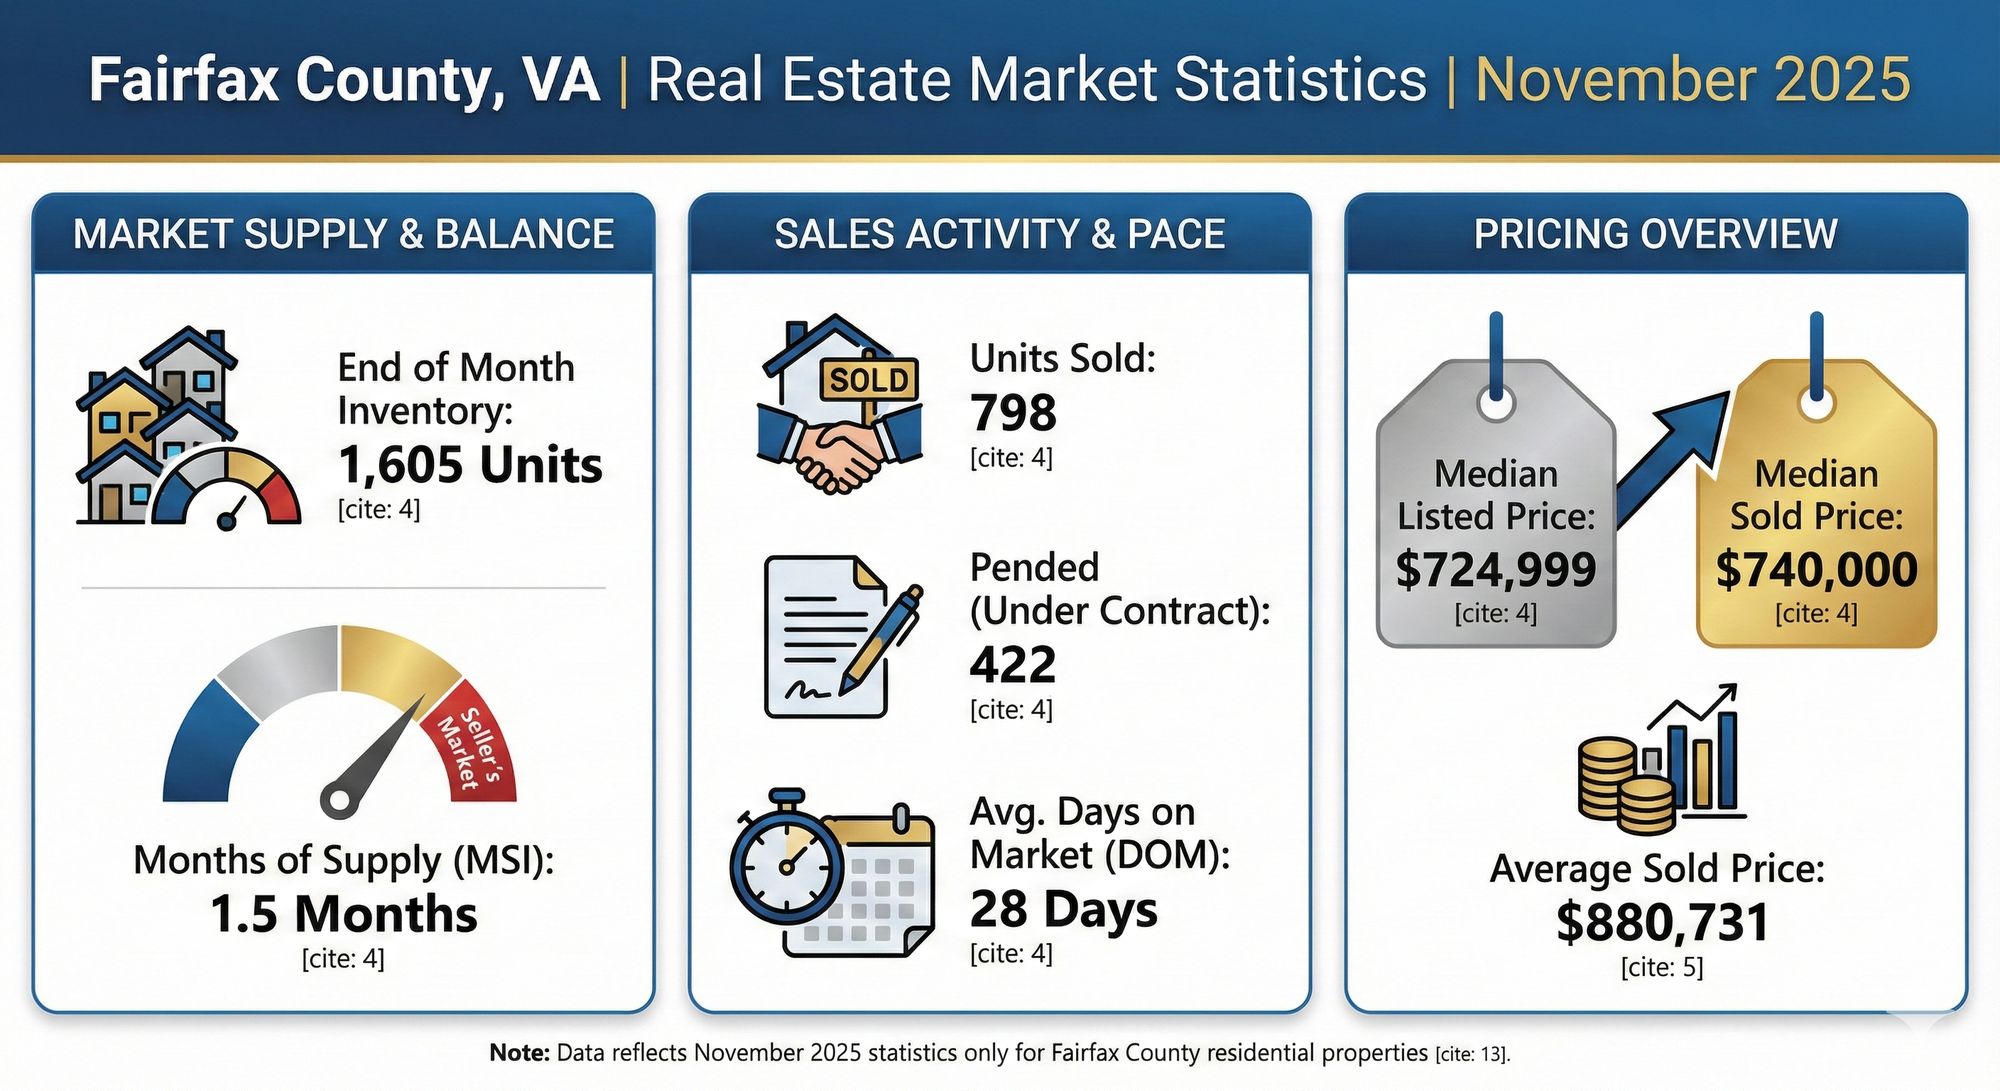
When you look at a weekly snapshot like Nov 30–Dec 6, you’re really seeing how the market behaves in “real time.” The numbers in your report show how many homes came on the market, how many went under contract, how many actually closed, how long they took to sell, and how close those sales were to their original list prices.
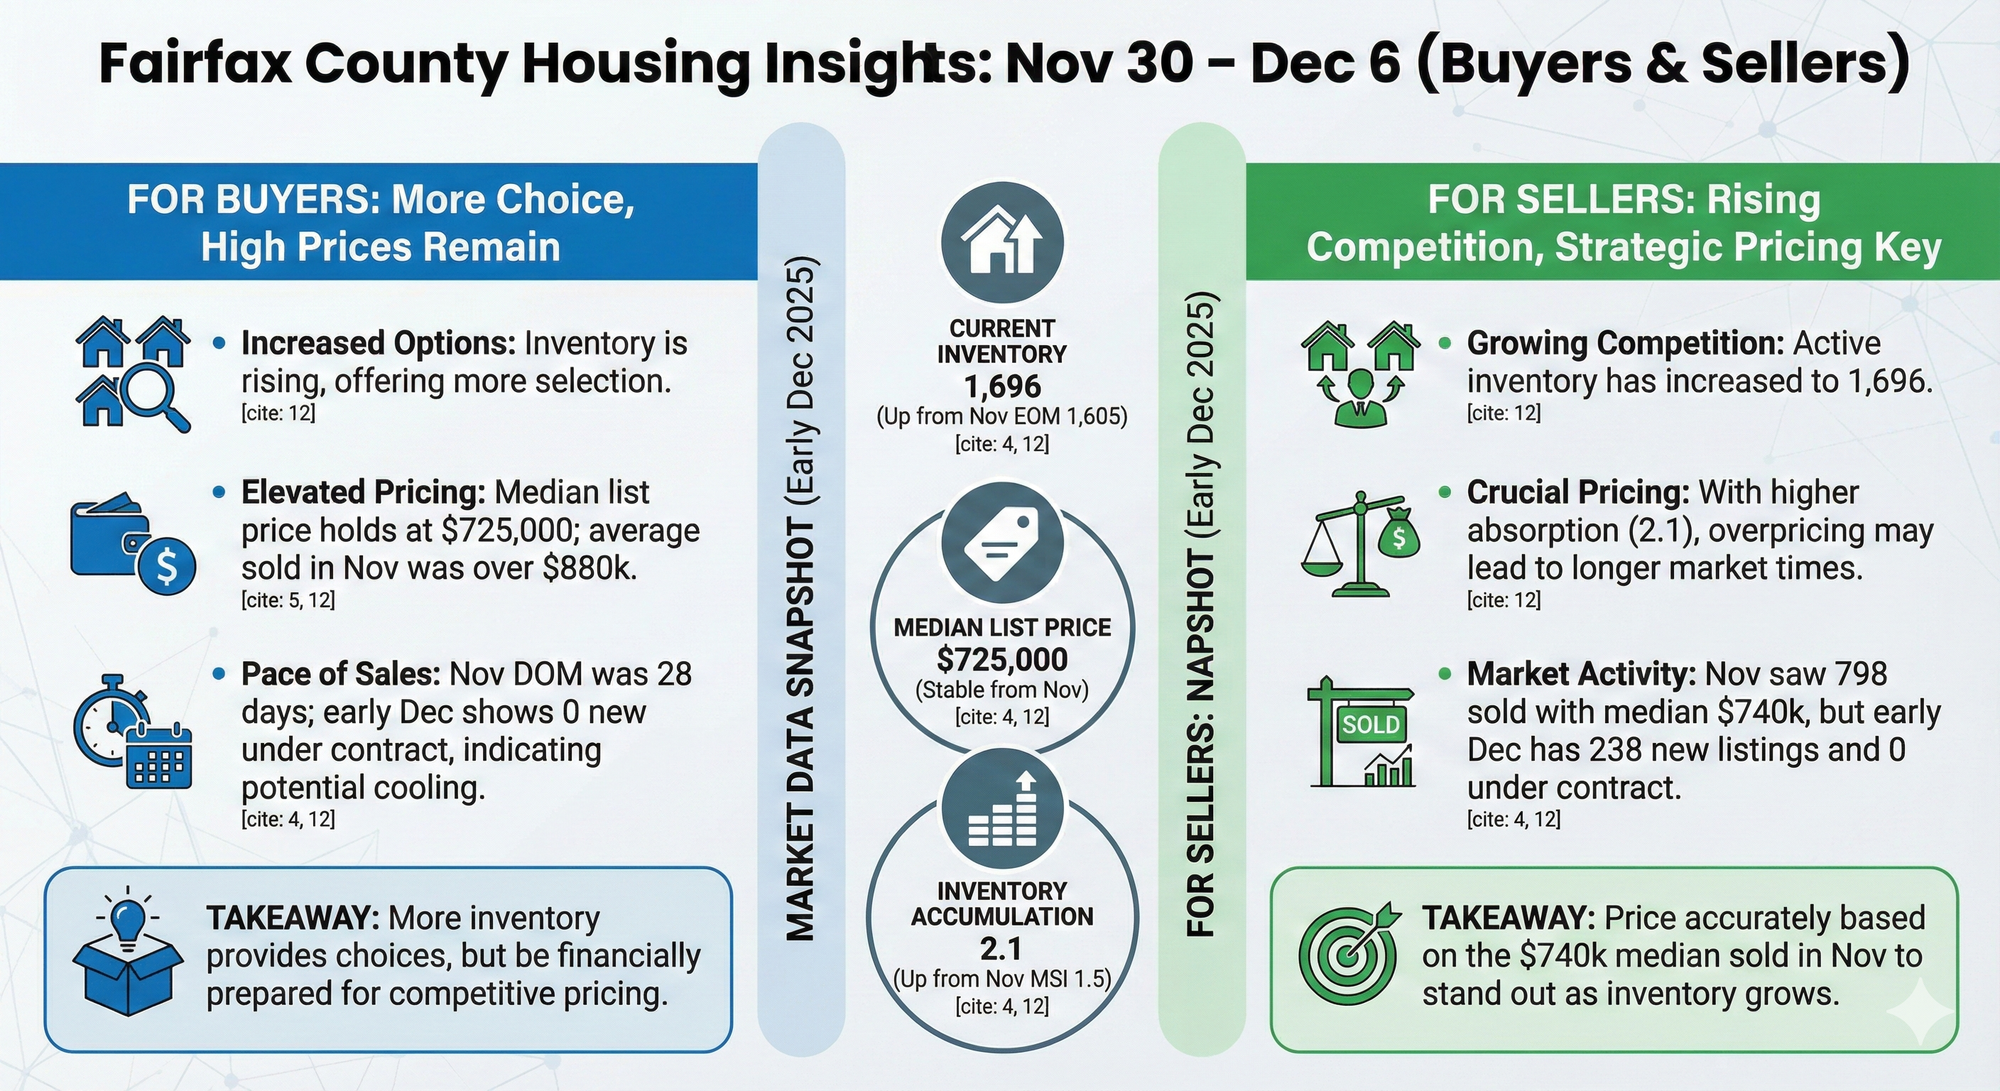
For sellers, the key takeaway is straightforward: properly priced, well-prepared homes are still moving. Weekly data rarely shows a market where everything stops; instead, it highlights which homes attract attention and which ones are ignored. When new listings, new contracts, and closed sales all show consistent activity, it means buyers are still out there, but they’re selective. If a home lingers, it’s usually because of price, condition, marketing, or a combination of all three.
For buyers, this same data sends a different message. The relationship between new listings and new contracts tells you how quickly good homes are getting absorbed. When contracts track close to new listings, it means the best options don’t sit around waiting for you. And when days on market are generally not extreme, you know that “thinking about it for a week” can easily turn into “we just missed it.”
The price information on the report gives you a realistic picture of what Fairfax County buyers are actually paying right now. It’s one thing to look at asking prices online; it’s another to look at actual sold prices across the county. That difference helps you set expectations: as a seller, you can see the range where buyers really are stepping up. As a buyer, you can see the level where competition tends to settle, not just where it starts.
Days on market and the sold-price-to-list-price relationship are also critical. Together, those two metrics tell you whether buyers are negotiating deep discounts, paying close to list, or occasionally going above. When those numbers cluster near “full price,” it usually means well-positioned properties are drawing strong interest. When you see more separation, it often points to overpricing or homes that need work.
The bottom line: this weekly report is not just “numbers for numbers’ sake.” It’s a simple way to see whether Fairfax County is leaning toward a seller-skewed environment, a more balanced one, or something softer. Right now, the pattern still supports serious sellers who are willing to meet the market and serious buyers who come in prepared with financing and clear expectations.
“Johnny is an outstanding real estate professional whom I highly recommend. He’s knowledgeable in every aspect of buying and selling, incredibly organized, and always one step ahead. He’s also very responsive, patient, and genuinely kind. Most importantly, he truly cares about what’s best for his clients.”
Common Misconceptions About Weekly Market Reports
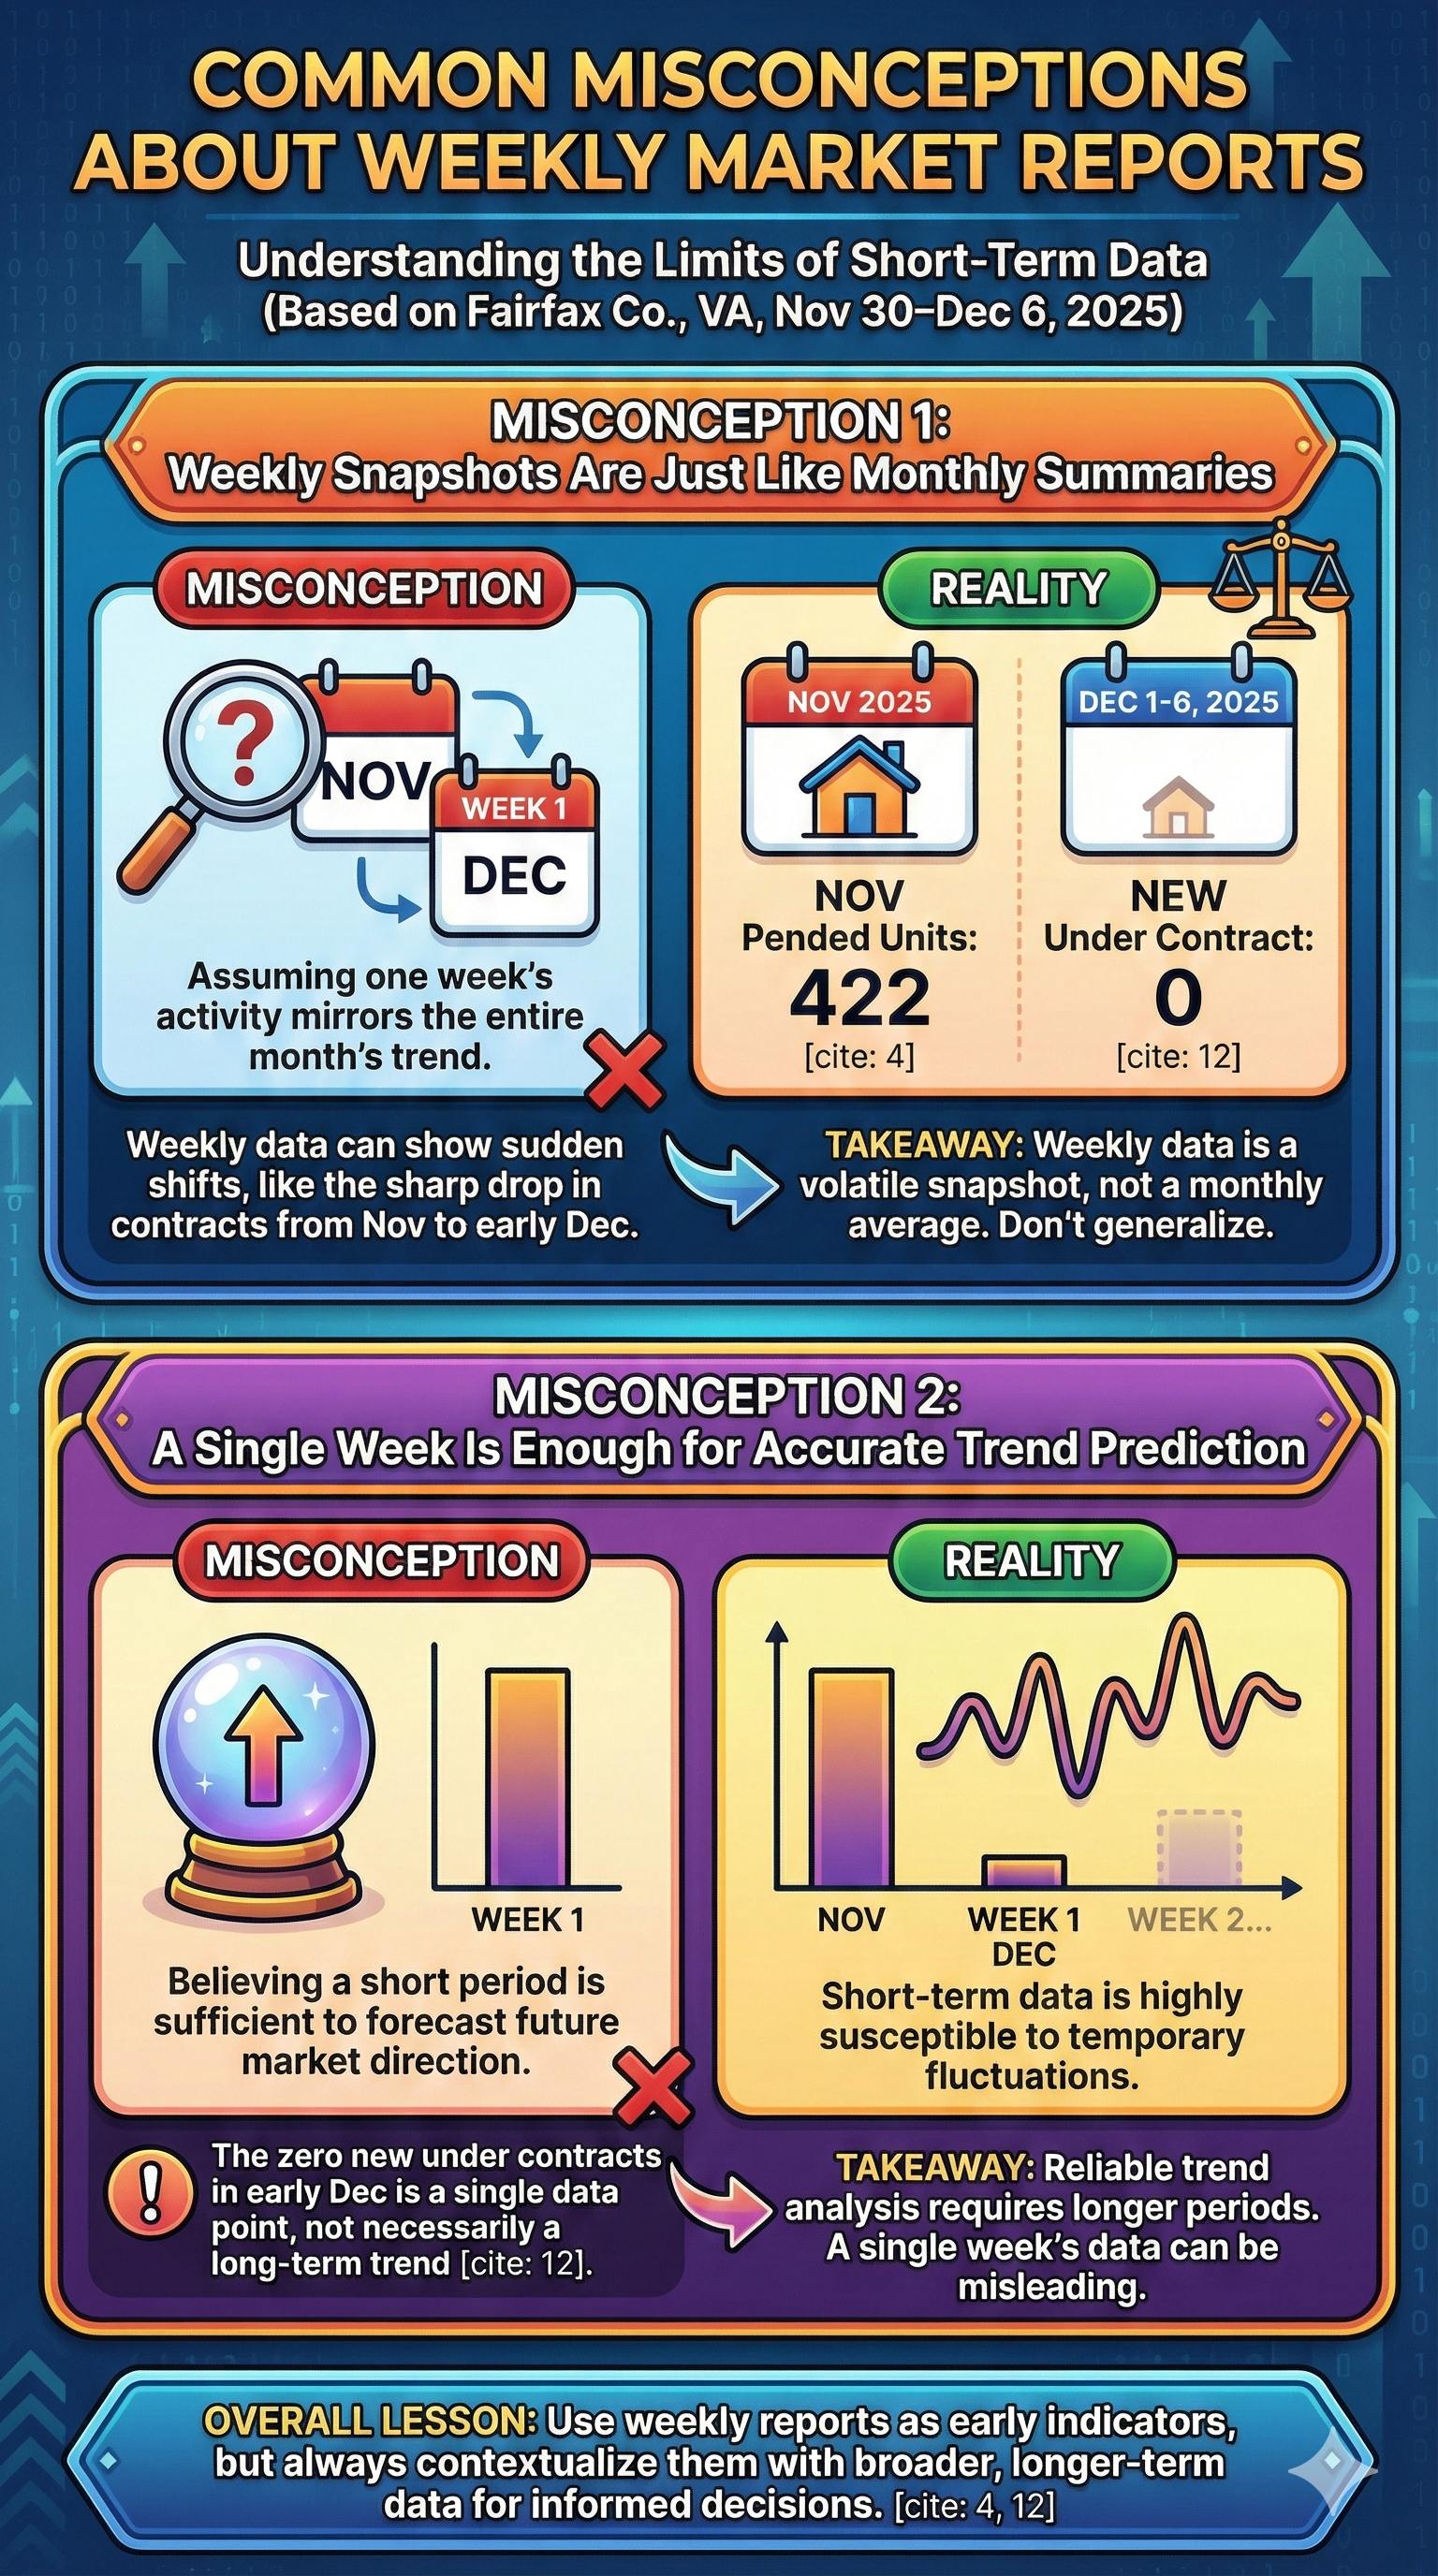
One of the biggest misconceptions about weekly data is that it’s “too small” to matter. The truth is, weekly reports are often where you first see a shift in buyer or seller behavior. A month or a quarter can smooth out the story; a week shows you how people are acting right now.
Another misconception is that county-wide numbers can’t help you make decisions on a specific home. While it’s true that every neighborhood behaves a little differently, the county snapshot still tells you whether you’re operating in a generally supportive or generally challenging environment. You then layer in hyper-local information when you’re ready to list or write an offer.
There’s also a tendency for both buyers and sellers to overreact to a single headline—“prices are up,” “prices are down,” “rates are high.” Your weekly Fairfax County report helps you cut through that noise. Instead of reacting to national news, you can look at what actually happened in your market between Nov 30 and Dec 6 and adjust your strategy accordingly.
Important Considerations Before You Make a Move
If you’re thinking about selling, your first step is not guessing at a price based on what you see online. It’s comparing your home—size, condition, location, and features—to the recent activity shown in reports like this one. That comparison is how you arrive at a pricing strategy that attracts real buyers instead of just generating clicks.
If you’re buying, start with clarity on your numbers: budget, monthly comfort level, and approval with a trusted lender. In a market where homes that “check the boxes” still move, you don’t want to be figuring out your financing after you’ve already found the one you love. Having those details in place before you act gives you confidence and makes your offer more attractive.
For homeowners who are not planning to move immediately, this kind of weekly data is still valuable. It gives you a sense of how your equity position may be evolving and how the market might treat you if your plans change in six or twelve months. Tracking the trend over time is often more important than any single data point.
“I wanted to thank Johnny for being a wonderful agent and really a kind gentleman. I have worked with him for a few years and I find him to be the most genuine and caring agent. He is superb and I recommend him to everyone. He gets to know his clients and treats them like family.”
FAQ
Is Fairfax County currently a buyer’s market or a seller’s market?
Based on the weekly activity for Nov 30–Dec 6, Fairfax County still shows the characteristics of a competitive market: limited inventory relative to demand and ongoing buyer activity. That usually leans toward a seller-friendly environment for homes that are priced and prepared correctly, and a very strategy-driven environment for buyers.
How should I use this weekly report if I’m a seller?
Use the report to understand how quickly homes are moving and how close they are selling to their list prices. That will help you decide on timing, pricing, and what condition buyers in your price range now expect. Then, sit down with a local agent who can overlay your specific neighborhood and property details on top of this county-wide picture.
How should I use this weekly report if I’m a buyer?
Look at the relationship between new listings, new contracts, and closed sales. If contracts and closings are keeping pace with new listings, it tells you good homes don’t sit long. That means you should be prepared to act confidently when the right home appears, instead of assuming you can wait weeks to decide.
Does this week’s data tell me what my home is worth?
Not by itself. Weekly county-wide data is a great context tool, but an accurate price opinion still requires a detailed review of recent comparable sales near your property. Think of this report as your “market climate,” and a custom valuation as your detailed forecast.
How often should I be watching Fairfax County housing data?
If you’re actively planning a move in the next 3–6 months, watching weekly or monthly updates is smart. It keeps you grounded in what’s really happening instead of reacting to headlines or rumors. If your plans are longer-term, checking in once a quarter is usually enough to stay informed.
Next Steps
If you’d like to walk through what this week’s Fairfax County housing data means for your specific situation—whether you’re thinking about buying, selling, or just planning ahead—reach out any time. A quick conversation can turn raw numbers into a clear plan.
Call or text: 703-400-9660
Visit: contactjohnny.com